By using root cause analysis, you can develop Objectives and Key Results (OKR), Critical to Quality (CTQ), Key Performance Indicators (KPIs), and Objectives/ Key Results (OKRs). Sometimes referred to as Ishikawa or “Fishbone” diagrams, the procedure builds a visual mind map that identifies possible causes. By applying various perspectives and asking sharper questions, you can lead a team to innovation.
Named after Professor Kaoru Ishikawa (University of Tokyo), he developed the root cause analysis method in 1945 to resolve steel production problems. Also known as “Fishbone” diagrams, they support analysis, identify gaps, and provide insight into possible SMART criteria (i.e., Specific, Measurable, Adjustable, Relevant, and Time-Based). Stress leading indicators, rather than lagging indicators. Clear and simple output makes it easier to assign follow-up activities that lead to innovation and proactive changes.
Jack Welsh, CEO Emeritus for the General Electric Company, instilled his organization with an understanding that “If you can’t measure it, you can’t manage it.” You can certainly facilitate OKLR, KPI, or almost any “fuzzy factor” and then convert them to SMART criteria by asking the right questions. Prioritized criteria form the foundation for major initiatives around Balanced Scorecard, dashboard techniques, portfolio decisions, and other essential organizational processes such as idea management and project or product prioritization.
How to Facilitate Root Cause Analysis
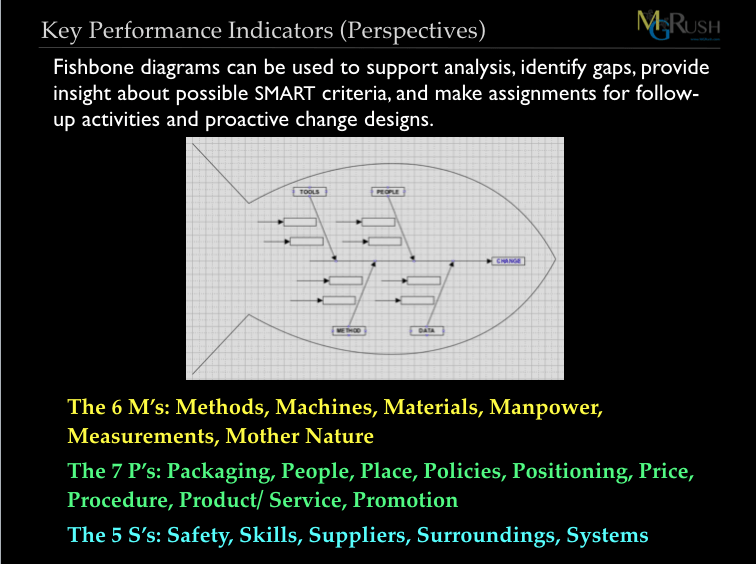
Also referred to as a Cause and Effect Diagram, here is how to facilitate root cause analysis. As you begin to facilitate root cause analysis, the illustration may resemble the skeleton of a fish with large bones (i.e., perspectives) and small bones (i.e., specific causes within each perspective).
The Fishbone Diagram
The fishbone diagram helps categorize the potential causes of problems using a structured manner so that the team can identify and focus on root cause analysis. Workshop steps to facilitate root cause indicators and build a simple cause and effect diagram include:
- In advance, prepare a blank fishbone drawing (devoid of content) using either multiple sheets of paper or some professional drawing tool.
- Use the objectives of the project to identify the “primary effect” or result that needs to be changed or accomplished. Decide on a phrase or a one-word label that captures the meaning of the end state. For example, the term “CHANGE” captures the ‘effect’ being analyzed in the drawing above.
- Based on importance and time limitations, constrain the total number of primary “causes,” between eight and twelve total. However, as a practical activity, you may also focus on fewer, even one or two primary perspectives, or four as illustrated above.
- Alternatively, you may launch a brainstorming activity of all possible causes, and then utilize a common purpose to help the team categorize them. Considering the Pareto Principle, many leaders approach their cause-and-effect diagrams with four high-impact perspectives. For example, study the perspectives below to isolate the ones most likely to have an impact. Four perspectives in the illustration include:
-
- Tools: Traditionally seen as the technology or equipment that leads to error, but could also reflect tangible resources that provide possible causes
- Method: Isolates the activities or tasks that might be the source of concern or the opportunity for improvement
- People: Intends to capture the group relationships and quality of decisions made
- Data: Traditionally seen as the information required by the causal element to create the desired effect
Use Breakout Teams for Root Cause Analysis
You might consider using breakout teams and assigning one or more primary perspectives or potential causes to each team. Strive to confirm the most likely cause as a large group before breaking out. Then assign different causes or perspectives to each team, or have them work offline for detailed development.
- During a break, lunchtime, or evening, create an illustration of your diagram. Additionally, provide your workshop participants with full narrative definitions for each of the perspectives used in your fishbone diagram.
- Depending on time constraints, lead your root cause analysis activity either by beginning with the most important perspective, taking the likely causes within a perspective, or perhaps grabbing the easiest to manage, the “low-hanging” fruit. Determine clear and simple questions in advance and know what you intend to do with the results. Understand the type of documentation required to satisfy your deliverables. For example, if you are leading up to a RACI (i.e., roles and responsibilities) chart, then articulate the next steps or activities that need to be assigned.
Building a fishbone diagram generates consensus around the assumptions. Once your participants fully understand the question, agree on the causes associated with each perspective. Their consensual understanding makes it easier to build consensus around priorities and next steps. Carefully identify WHO does WHAT by WHEN to design your next steps.
Changing Perspectives for Root-Cause Analysis
NOTE: Use any of the perspectives suggested below and combine perspectives from different categories, or make up your own perspective to help your group focus their input from a specific point of view. Identify potential root causes within each primary area or perspective. Borrow liberally from the five perspectives below listing 30 potential causes:
The 6 M’s Category
-
- Machines, Manpower. Materials, Measurements, Methods, Mother Nature
The 7 P’s Category
-
- Packaging, People, Place, Policies, Positioning, Price, Procedure, Product/ Service, Promotion
The 5 S’s Category
-
- Safety, Skills, Suppliers, Surroundings, Systems
Six Trends from the World Future Society
-
- Demographic—covers specific population groups, family composition, public health issues, etc.
- Economic—includes finance, business, work and careers, and management
- Environmental—includes resources, ecosystems, species, and habitats
- Governmental—includes world affairs, politics, laws, and public policy
- Societal—covers lifestyles, values, religion, leisure, culture, and education
- Technological—includes innovations, scientific discoveries, and their effects
Six Purchasing Value/ Utility Levers and Potential Bottlenecks
-
- Customer productivity
- Simplicity
- Convenience
- Risk
- Fun and image
- Environmental friendliness
Digging Deep
Use an idea-generating technique to identify factors within each perspective that could cause the problem being analyzed. For example, ask… “What are the possible machine issues affecting/ causing…?”
- Repeat this procedure with each perspective to produce potential causes. Continue asking, “Why is this happening?” and put additional causes against each perspective.
- Exhaust each perspective until you no longer get useful information as you ask, “Why is that happening?”
- Analyze the results of the fishbone after team members agree that an adequate amount of detail has been provided under each major perspective. Look for those items that appear in more than one perspective. These repetitive factors become highly likely as frequent causes that will demand more time and generate longer discussions.
- For those factors identified as the “most likely causes,” use a prioritization method to lead the team to a consensus about listing those factors in sequential priority, with the first factor being the “most probable” or “most impactful” cause. For a simple and highly effective prioritization method:
- Build the criteria for evaluation.
- Separate the SMART from the fuzzy (where SMART discussed elsewhere equates to Specific, Measurable, Adjustable, Relevant, and Time-Based as compared to DUMB which equates to Dull, Ubiquitous, Myopic, and Broad).
- Prioritize or rank the criteria using PowerBalls and Bookends.
- Appealing to the criteria, helps the group identify the most impactful of the “most likely causes.”
- Where the group remains uncertain, challenge any fuzzy factors to create understanding, but only let them use the fuzzy factors when discussing critical causes. Do not let them waste time with the least important causes (unless full diligence is required across every potential cause).
- Optionally, repeat this process when you prioritize solutions by focusing on decision criteria.
For More Root Cause Analysis Tools
For additional visual support and tool instructions on facilitating root cause analysis, see the article by Amanda Athuraliya, The Easy Guide to Root Cause Analysis for Efficient Business Problem-Solving.
______
Consensus Mastery and Facilitation require more than understanding the ‘what’—it’s about mastering the ‘how.’ Building consensus demands a unique blend of human-centric skills and analytical tools to ensure inclusivity, rigor, and actionable outputs. Take the first step toward transforming your facilitation skills: identify where your organization or team faces the greatest challenges by cross-referencing these factors as you plan your next meeting or workshop. Ready to elevate your impact? Join our Professional Workshop to gain hands-on insight, practice, and feedback, empowering you to lead with confidence and achieve lasting results. Click here to secure your spot today!
______
Our workshops also provide a superb way to earn up to 40 SEUs from the Scrum Alliance. Receive 40 CDUs from IIBA, 40 Continuous Learning Points (CLPs) based on Federal Acquisition Certification Continuous Professional Learning Requirements using Training and Education activities, 40 Professional Development Units (PDUs) from SAVE International. Finally, receive 4.0 CEUs for other professions. (See workshop and Reference Manual descriptions for details.)
______
With “Bookmarks” no longer a feature of WordPress, note the following that we are providing for your immediate benefit and long-term reference.
- 20 Prioritization Techniques = https://foldingburritos.com/product-prioritization-techniques/
- Creativity Techniques = https://www.mycoted.com/Category:Creativity_Techniques
- Facilitation Training Calendar = https://mgrush.com/public-facilitation-training-calendar/
- Liberating Structures = http://www.liberatingstructures.com/ls-menu
- Management Methods = https://www.valuebasedmanagement.net
- Newseum = https://www.freedomforum.org/todaysfrontpages/
- People Search = https://pudding.cool/2019/05/people-map/
- Project Gutenberg = https://www.gutenberg.org/
- Scrum Events Agendas = https://mgrush.com/blog/scrum-facilitation/
- Speed test = https://www.speedtest.net/result/8715401342
- Teleconference call = https://youtu.be/DYu_bGbZiiQ
- The Size of Space = https://neal.fun/size-of-space/
- Thiagi/ 400 ready-to-use training games = http://thiagi.net/archive/www/games.html
- Visualization methods = http://www.visual-literacy.org/periodic_table/periodic_table.html#
- Walking Gorilla = https://youtu.be/vJG698U2Mvo
______
Don’t ruin your career by hosting bad meetings. Sign up for a workshop or send this to someone who should. MGRUSH workshops focus on meeting design and practice. Each person practices tools, methods, and activities daily during the week. Therefore, while some call this immersion, we call it the road to building high-value facilitation skills.
Want a free 10-minute break timer? Sign up for our once-monthly newsletter HERE and receive a free timer along with four other of our favorite facilitation tools.

Terrence Metz, president of MG RUSH Facilitation Training, was just 22-years-old and working as a Sales Engineer at Honeywell when he recognized a widespread problem—most meetings were ineffective and poorly led, wasting both time and company resources. However, he also observed meetings that worked. What set them apart? A well-prepared leader who structured the session to ensure participants contributed meaningfully and achieved clear outcomes.
Throughout his career, Metz, who earned an MBA from Kellogg (Northwestern University) experienced and also trained in various facilitation techniques. In 2004, he purchased MG RUSH where he shifted his focus toward improving established meeting designs and building a curriculum that would teach others how to lead, facilitate, and structure meetings that drive results. His expertise in training world-class facilitators led to the 2020 publication of Meetings That Get Results: A Guide to Building Better Meetings, a comprehensive resource on effectively building consensus.
Grounded in the principle that “nobody is smarter than everybody,” the book details the why, what, and how of building consensus when making decisions, planning, and solving problems. Along with a Participant’s Guide and supplemental workshops, it supports learning from foundational awareness to professional certification.
Metz’s first book, Change or Die: A Business Process Improvement Manual, tackled the challenges of process optimization. His upcoming book, Catalyst: Facilitating Innovation, focuses on meetings and workshops that don’t simply end when time runs out but conclude with actionable next steps and clear assignments—ensuring progress beyond discussions and ideas.


