Facilitate Consensual Prioritization Using a Perceptual Map
A perceptual map works well when the PowerBall approach is not robust enough, yet many of your attributes and criteria remain fuzzy and subjective. Thus we are able to help a team compare and prioritize its options using a rich visual display, called a perceptual map, that provides visual support (in a directional manner) of your optimal and sub-optimal options.

Illustrative Perceptual Map on Customer Loyalty
Rationale for a Perceptual Map
With a perceptual map, we can also expand our understanding of the options, since there is likely more than one right answer. By locating the options we stimulate discussion and solicit the rationale for placement. The analysis provides insight into which options may demand more or less urgent attention and care.
Method One for a Perceptual Map
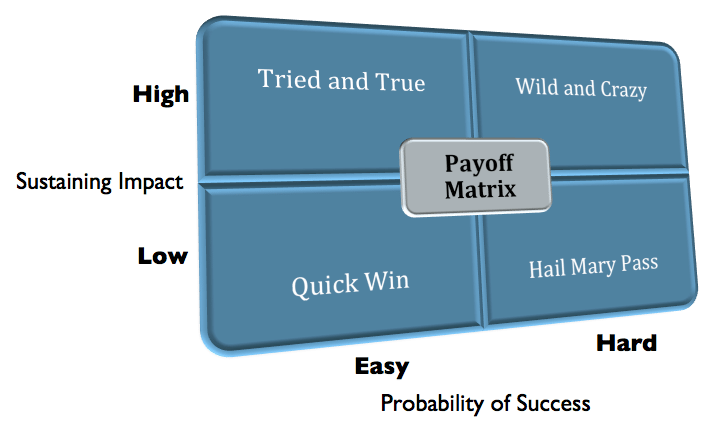
After you have helped the team build their options (e.g., actions to take), consider arranging them along a perceptual map. One version called a Payoff Matrix dimensions includes: 1) Ease of implementation, and 2) Impact of the solution.
- If you have dozens of options, consider using a large whiteboard.
- You should use Post-It® notes because the discussion will lead to moving around (relocating) some of the options.
- Be careful to know how to illustrate and define “High” and “Low” and to the extent possible, draw from your personal metaphor or analogy (Agenda discussion point in the MGRUSH curriculum).
- Use active listening and challenge frequently to discover evidence that can be used to support beliefs and claims. Enlighten all participants as to which conditions are required to support the arguments.
- Modify the “Two-by-Two” illustration below by adding a moderate dimension, making it what others call a “Nine-Block Diagram” (or “9-Block Diagram”) shown at the bottom.
- In Six Sigma, comparisons are made of the CTQs (Critical to Quality) with the improvement or weighting factors.

An Illustrative Perceptual Map and Generic Payoff Matrix
Method Two for a Perceptual Map
You can also facilitate building a perceptual map by creating the following nine-block:
- Identify two dimensions that most affect the decision or situation.
- Typically array from low to high but be prepared to define what is meant by “Low” or “High” (see video on PowerBalls).
- If you need to use a third dimension, such as quantity, consider varying your symbols or notes. Change the size of the Post-It notes so that width, height, or shape equates to the third dimension.
- Consider using different colored Post-It notes that relate to a third or fourth dimension such as large, medium, and small.
- The alternative shown next is the Nine-Block Diagram that provides an additional, third sector of information contrasted to the Two-by-Two up above.

A Nine-Block Perceptual Map
______
Don’t ruin your career by hosting bad meetings. Sign up for a workshop or send this to someone who should. MGRUSH workshops focus on meeting design and practice. Each person practices tools, methods, and activities every day during the week. Therefore, while some call this immersion, we call it the road to building high-value facilitation skills.
Our workshops also provide a superb way to earn up to 40 SEUs from the Scrum Alliance, 40 CDUs from IIBA, 40 Continuous Learning Points (CLPs) based on Federal Acquisition Certification Continuous Professional Learning Requirements using Training and Education activities, 40 Professional Development Units (PDUs) from SAVE International, as well as 4.0 CEUs for other professions. (See workshop and Reference Manual descriptions for details.)
Want a free 10-minute break timer? Sign up for our once-monthly newsletter HERE and receive a timer along with four other of our favorite facilitation tools, free.
Terrence Metz, president of MG RUSH Facilitation Training, was just 22-years-old and working as a Sales Engineer at Honeywell when he recognized a widespread problem—most meetings were ineffective and poorly led, wasting both time and company resources. However, he also observed meetings that worked. What set them apart? A well-prepared leader who structured the session to ensure participants contributed meaningfully and achieved clear outcomes.
Throughout his career, Metz, who earned an MBA from Kellogg (Northwestern University) experienced and also trained in various facilitation techniques. In 2004, he purchased MG RUSH where he shifted his focus toward improving established meeting designs and building a curriculum that would teach others how to lead, facilitate, and structure meetings that drive results. His expertise in training world-class facilitators led to the 2020 publication of Meetings That Get Results: A Guide to Building Better Meetings, a comprehensive resource on effectively building consensus.
Grounded in the principle that “nobody is smarter than everybody,” the book details the why, what, and how of building consensus when making decisions, planning, and solving problems. Along with a Participant’s Guide and supplemental workshops, it supports learning from foundational awareness to professional certification.
Metz’s first book, Change or Die: A Business Process Improvement Manual, tackled the challenges of process optimization. His upcoming book, Catalyst: Facilitating Innovation, focuses on meetings and workshops that don’t simply end when time runs out but conclude with actionable next steps and clear assignments—ensuring progress beyond discussions and ideas.